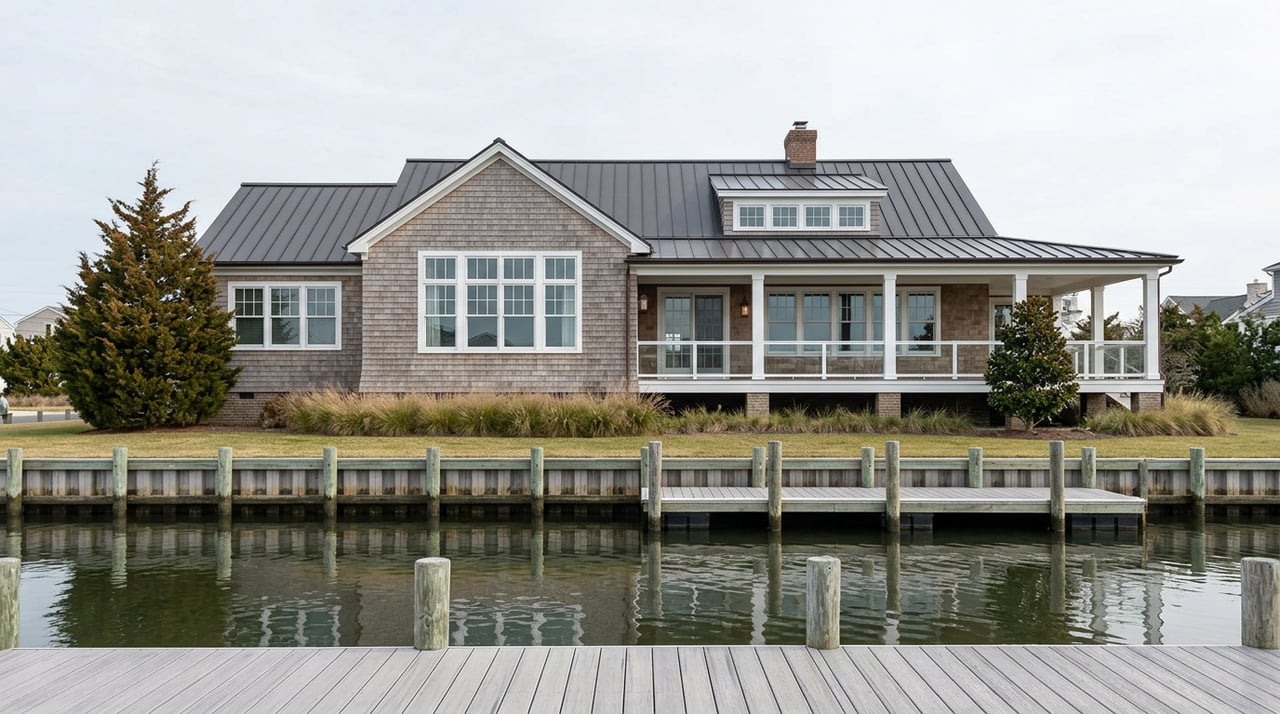
In May of 1996, a house at 1 Queen St. in Rehoboth Beach sold at a widely publicized online auction for $1.854 million, an unusual enough event at the time that bidders monitored it over an early internet connection while a Cornell-built video system let a lucky few watch from home. The same house sold again in 2001 for $3.025 million. Following Sussex County's most recent reassessment, it now carries an estimated value of $5.36 million.
That trajectory tells you something true about oceanfront Rehoboth real estate over thirty years. It also tells you almost nothing about what a typical in-town cottage two blocks off the boardwalk is worth today. And that gap, between the handful of trophy sales that make headlines and the much larger, quieter market around them, is exactly what makes Rehoboth Beach's "median price" such an unreliable number to lean on by itself.
The Number That Won't Sit Still
Pull up Rehoboth Beach on three different real estate data sites this month and you will get three different stories about the same town.
One shows the average home value sitting at $811,382, up a modest 2.8 percent over the past year, the kind of steady climb you would expect in a mature coastal market. Another, looking at the most recent month of closed sales, puts the median sale price at $1.96 million, up 106 percent year over year, which would suggest the market has essentially doubled. A third, looking at the trailing 12 months of closings, has the median at $748,530, down 8 percent from the prior 12-month stretch.
Read those three numbers side by side and Rehoboth Beach is simultaneously flat, doubling, and cooling. That is not a data error. It is what happens when a small number of very expensive closings pass through a market with a very small denominator.
| Data source | Metric | Figure | Direction |
|---|---|---|---|
| Smoothed valuation index | Average home value | $811,382 | Up 2.8% year over year |
| Most recent month of closings | Median sale price | $1.96 million | Up 106% year over year |
| Trailing 12 months of closings | Median sale price | $748,530 | Down 8% from prior 12 months |
| Trailing 12 months of closings | Active listings / homes sold | 163 active, 462 sold | Roughly 38 sales per month |
Why a Small Market Does This
Rehoboth Beach sells something like 462 homes a year, or roughly 38 a month, across a range that runs from boardwalk condos in the low $200,000s to canal and oceanfront estates well past $5 million. With 163 active listings at any given time, this is not a market with enough monthly volume to smooth out a few outsized transactions.
Picture a month where three or four closings happen to be waterfront. A canal-front estate at Rehoboth Beach Yacht and Country Club, sitting at the intersection of three canals with more than 275 feet of bulkheaded frontage and a private dock, can trade for many multiples of a typical in-town cottage. So can a Silver Lake property with full water access, or an oceanfront condo on the boardwalk with unobstructed Atlantic views. Drop three or four of those into a month with only 30 to 40 total closings, and the median for that month swings hard toward the high end, even though nothing changed for the buyer looking at a three-bedroom bungalow on a gridded interior street.
That is the mechanism behind the 106 percent jump. It is not that every home in Rehoboth appreciated overnight. It is that the mix of what happened to close in that particular window shifted toward the expensive end of the range. Widen the window to a full trailing 12 months, and the mix normalizes, which is likely part of why the 12-month median comes in nearly $1.2 million lower and shows a decline rather than a spike.
A market this size does not average itself out the way a large metro does. Every closing carries real weight in the statistic.
What a Smoothed Index Is Actually Measuring
The $811,382 average value figure moves so much more calmly than the median because it is not simply averaging recent sale prices. Valuation models like this one are built to estimate what a broad set of homes across the market are worth, adjusted for typical characteristics, rather than to report on whichever properties happened to close last month. It is a useful gauge of the underlying market's general direction. It is a poor tool for answering the specific question a buyer or seller usually wants answered, which is what a particular type of home in a particular part of town is likely to sell for right now.
That distinction matters more in Rehoboth than in a market with thousands of monthly transactions, because the mismatch between the smoothed index and the raw median is so wide it can look like the two sources disagree about basic reality.
What This Means If You're Pricing a Listing or Sizing Up a Purchase
The practical takeaway is not to distrust median price data. It is to ask what specifically sold before treating a median as a stand-in for your situation.
If you are listing an in-town cottage, a headline median swayed by a Silver Lake estate or a Yacht and Country Club canal property tells you almost nothing useful about your pricing strategy. You want the median and price per square foot for homes that match your property's location, size, and water access, not the townwide blend.
If you are shopping in the luxury waterfront tier, the opposite caution applies. A calm-looking 2.8 percent annual gain in a smoothed index can understate how competitive bidding gets for the specific handful of canal and oceanfront properties that come up in a given season, since those transactions are exactly the ones capable of moving a monthly median by seven figures.
Either way, the number worth asking your agent for is not "what's the median in Rehoboth Beach." It's "what closed in the segment I'm actually buying or selling into, and over what window." With only about 38 sales a month spread across a wide price range, that segment-level view is the only version of the data that behaves the way you'd expect a median to behave.
FAQ
Why do Zillow, Redfin, and Homes.com show such different numbers for the same town? They are measuring different things. A smoothed valuation index estimates broad market value across many properties. A monthly median reflects only whatever happened to close that month. A trailing 12-month median smooths that out over a longer window but still reflects actual closings rather than an estimate. In a market with only a few dozen sales a month, these three approaches can diverge sharply.
Is the Rehoboth Beach market actually up or down in 2026? Both of the raw closing-based medians tell a real story, but they are stories about different stretches of time and different mixes of homes. The steadier read comes from the smoothed valuation index, which points to modest, single-digit annual growth rather than the dramatic swings the monthly figures can show.
How should I use median price data if I'm about to list my home? Ask for a comparison built around homes similar to yours in location, size, and water access, drawn from recent closings in that specific segment, rather than the townwide median. In a market this thin, segment-level data is far more predictive than the headline number.
If you're trying to figure out what your Rehoboth Beach home is actually worth in today's market, or which segment of this town fits what you're looking for, Betsy Perry has spent years watching exactly which sales move these numbers and which ones don't. Let's talk about your next coastal move.